Release Notes 2.5.24
Weave 2.5.24 includes a number of bug fixes and enhancements.
This release is predominately focused on fixing bugs with some of the more recent tools while expanding on the functions provided by these tools. These enhancements have increased the flexibility and usability of some of Weave's standard tools. It also includes a number of security and REST API updates.
A full list of changes can be found at the Weave What's New page.
Main enhancements in Weave 2.5.24 are:
![]() BIRT Reports
BIRT Reports
A. Select Layers for Map in a Report
It is now possible to set up BIRT report that allow users to select layers they want from a list (of predefined layers) to appear on a map in the BIRT report. This means you can add flexibility to your existing reports with a minor change.
To set layers to be drawn in a BIRT report via user parameter, open the BIRT Report Designer and:
- Add a new Report Parameter to the map
- Outline > Report Parameters > New Parameter
- Make the new parameter a List Box
- Press the New button to create a new list entry.
- Put the layer value in the Value column. This is the layer item from your ToC model.
E.g. If this was in your ToC model:<entry id='l_mapengine.testing_planning_zones_copy' layer='Planning Zone Labels' label='Planning Zone Codes' checked='true'/>
Then the bold text,Planning Zone Labels, is what you'd put in the Value column. - You can list individual layers (so the user only gets to choose one layer) ...
- Or list individual layers, and then check the Allow Multiple Values option (so the user can choose more than one layer) ...
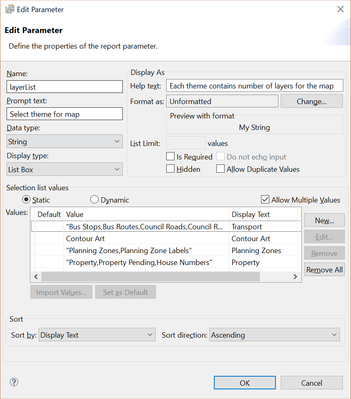
- Or, use themes/groups (so the user chooses one group name that equates to multiple layers). In this case:
- Set the Display Text to be the theme/group name
- In Value column, list the layer names (which is the layer value from the ToC model or the name of the layer coming from the Map Engine). The names should be separated by a comma, no space, and the whole thing must be enclosed in double quotes (see the image below).
- Add this user parameter to the map element.
- Click on the map from the report preview
- Go to Properties Editor - Map > Spatial > Layers
- For the Show Layers item, add the reference to your new parameter, e.g.
params["layerList"].value(where the parameter is called “layerList”).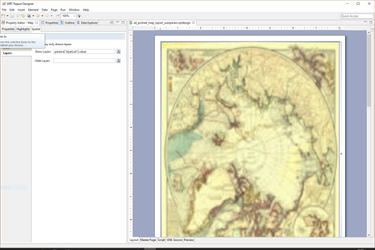
- If you want these layers to appear in the legend
- Click on the legend from the report preview
- Go to Properties Editor – Legend window > Spatial > Layers
- For the Show Layers item , add the reference to your new parameter, e.g.
params["layerList"].value(where the parameter is called “layerList”)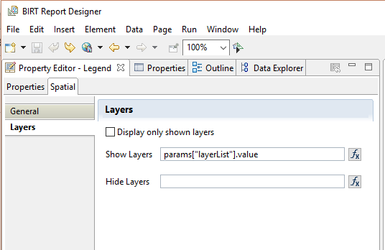
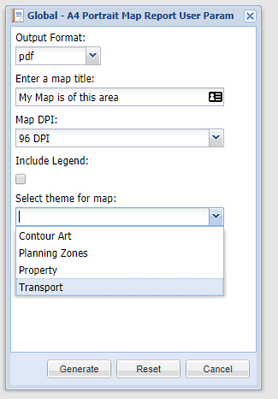
- This will produce the following report menu in Weave:
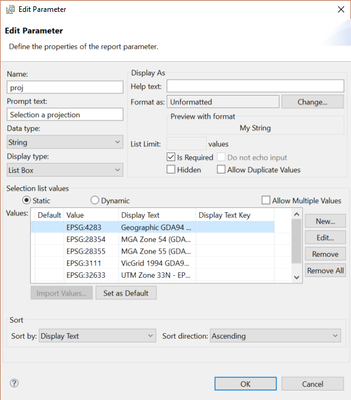
B. Set Coordinate System for Map in Report
Prior to Weave 2.5.24, a CRS could be set for a map by manually adding a "crs" property. This has now been extended so that the CRS can be set by the user via the UI.
To set the CRS for a BIRT report as a user parameter, open the BIRT Report Designer and:
- Add a new Report Parameter to the map, called proj:
- Outline > Report Parameters > New Parameter
- Make the new parameter a List Box
- Press the New button to create a new list entry.
- Enter the projection information in the Value column as “EPSG:xxxx” as shown in image.
- Enter the Display Text as what you want to appear to the user on the report window.
- Add as many CRS entries as you need using steps c to e above.
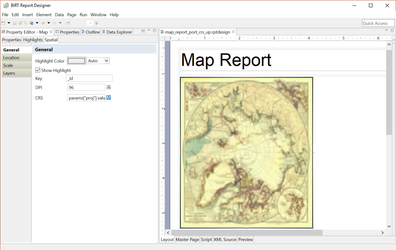
- Add this user parameter to the map element:
- Click on the map from the report preview
- Go to Properties Editor – Map window > Spatial > General
- Add the report parameter to the CRS item as shown in image.
![]() Weave Administration
Weave Administration
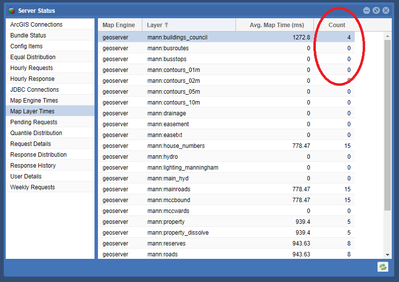
The number of times each map layer is accessed is logged as part of the Weave logging process.
- The number of times a layer is drawn has been added to the Map Layer Times panel in the Server Status Tool in the Admin Tool. It's under the heading of "Count".
- Or shown on the equivalent of the http://localhost:8080/weave/server/status?page=map.logging.layer page.
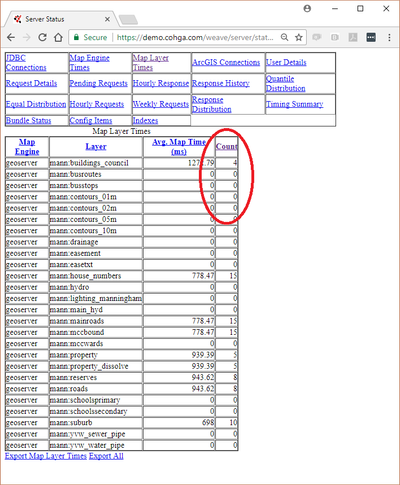
- Turning the layer off/on, without any other change to the map, won't increment the count as this just uses the browser's cached version of the image and does not go to the server to request the map again. If any navigation tools are used to change the map extent and layers are redrawn, then the count will be incremented by one for each change.
- This additional piece of logging data will help Weave Administrators identify layers that are seldom or never used.