Server Status Tool
- Lucy Minato (Deactivated)
- Graeme Taylor
- Shaun Forbes
This tool is available for versions of Weave from 2.5.20.
The Server Status Tool displays details about the internals of the Weave server by a number of different measures. This tool is useful for monitoring the performance of your Weave installation.
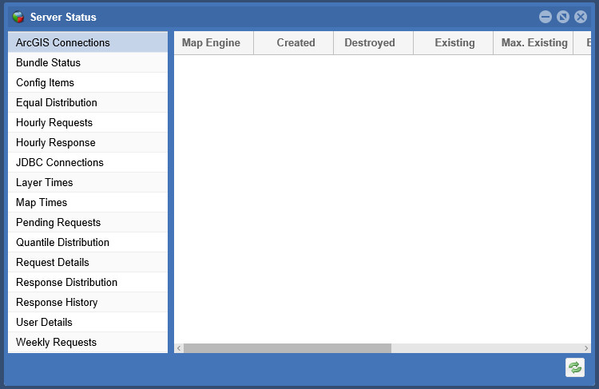
There are a number of items that are reported and these are listed in the left panel of the window, click on one of these items and the monitoring details are shown in the right panel. The items that are reported are briefly explained below, for more details on the values reported refer to the Server Status page.
- ArcGIS Connections
- Shows details about the connections Weave has created for connections to ArcGIS Server that have pooling enabled. Refer to this page for more details.
- Bundle Status
- Provides an overview of the state of the OSGi bundles that make up the Weave instance.
- Config Items
- Provides an overview of the configuration items that the Weave instance currently has registered.
- If an item is listed here, it does not guarantee that the configured item is correct and working, just that the configuration (usually from a
config.xmlfile) has been read and registered with the system. - Items are listed alphabetically by Id with upper case listed before lower case characters.
- Equal Distribution
- Provides a breakdown of response times (in milliseconds), grouping data so that there is equal (or as equal as possible) time period between each group's minimum and maximum response times. Refer to this page for more details.
- Hourly Requests
- Provides an overview of how many requests are made during each hour of the day. Refer to this page for more details.
- Hourly Response
- Provides an historical overview of how many requests are made and how long responses are taking broken down by how many hours ago the request was made. Refer to this page for more details.
- JDBC Connections
- Shows details about the connections Weave has created for connections to databases that have pooling enabled. Refer to this page for more details.
- Map Times
- Shows the average response time (in milliseconds) for a request sent to a Map Engine to generate a map image.
- Layer Times
- Shows the average response time (in milliseconds) for a request sent to a Map Engine to generate a map image for the Map Engine that contains this layer. Note that this is not how long it takes to draw the individual layer, rather it's how long the entire map image, including all layers, takes to draw, it's basically averaging the Map Times value against the layers.
- Pending Requests
- Gives a overview of what requests are currently being performed by the server. Refer to this page for more details.
- Quantile Distribution
- Provides a breakdown of response times, grouping the data so that there is an equal (or as equal as possible) request count in each group. Refer to this page for more details.
- Request Details
- Gives a brief overview of the different requests that the users' browsers have made to the server. Refer to this page for more details.
- Response Distribution
- Provides a quick overview of the distribution of response times (in seconds). Refer to this page for more details.
- Response History
- Provides an historical overview of how many requests are made and how long responses are taking for periods ranging from the previous minute up to the previous week (up to a maximum of 50,000 requests). Refer to this page for more details.
- User Details
- Gives a brief overview of a user's usage of the server. Refer to this page for more details.
- Weekly Requests
- Provides an overview of how many requests are made during each hour of the day for each day of the week. Refer to this page for more details.
Some of the values are reset when the Weave server is restarted and some are persisted across restarts.
This tool provides similar details to those that can be accessed through a browser at: http://<server>:<port>/weave/server/status.
For more details see: